فائل:StationaryStatesAnimation.gif

Page contents not supported in other languages.
آزاد انسائیکلوپیڈیا، وکیپیڈیا توں

StationaryStatesAnimation.gif(۳۰۰ × ۲۸۰ پکسلز, فائل حجم: ۲۲۳ کلوبائٹ, MIME type: image/gif، ؜لوپڈ، ؜۴۱ فریمز)

ایہ فائل Wikimedia Commons توں اے تے دوجیاں ویونتاں تے وی ورتی جاسکدی اے۔ گل بات اس دے فائل گل بات صفحہ تے تھلے دتی گئی۔

خلاصہ

تفصیل
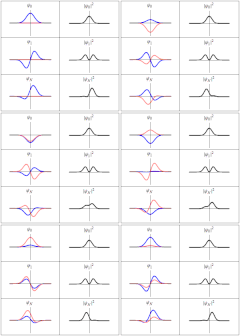
English: Three wavefunction solutions to the Time-Dependent Schrödinger equation for a harmonic oscillator. Left: The real part (blue) and imaginary part (red) of the wavefunction. Right: The probability of finding the particle at a certain position. The top two rows are the lowest two energy eigenstates, and the bottom is the superposition state , which is not an energy eigenstate. The right column illustrates why energy eigenstates are also called "stationary states".
Thus in every quantum stae,there are certain preferred positions of maximum probability
تریخ
سروت آپݨا کم
لکھاری Sbyrnes321
(* Source code written in Mathematica 6.0 by Steve Byrnes, Feb. 2011. This source code is public domain. *)
(* Shows classical and quantum trajectory animations for a harmonic potential. Assume m=w=hbar=1. *)
ClearAll["Global`*"]
(*** Wavefunctions of the energy eigenstates ***)
psi[n_, x_] := (2^n*n!)^(-1/2)*Pi^(-1/4)*Exp[-x^2/2]*HermiteH[n, x];
energy[n_] := n + 1/2;
psit[n_, x_, t_] := psi[n, x] Exp[-I*energy[n]*t];
(*** A non-stationary state ***)
SeedRandom[1];
psinonstationary[x_, t_] := (psit[0, x, t]+psit[1, x, t])/Sqrt[2];

(*** Put all the plots together ***)
SetOptions[Plot, {PlotRange -> {-1, 1}, Ticks -> None, PlotStyle -> {Directive[Thick, Blue], Directive[Thick, Pink]}}];
MakeFrame[t_] := GraphicsGrid[
   {{Plot[{Re[psit[0, x, t]], Im[psit[0, x, t]]}, {x, -5, 5}, PlotLabel -> Subscript[\[Psi],0]], 
     Plot[Abs[psit[0, x, t]]^2, {x, -5, 5}, PlotStyle -> Directive[Thick, Black],
		PlotLabel -> TraditionalForm[Abs[Subscript[\[Psi],0]]^2]]},
   {Plot[{Re[psit[1, x, t]], Im[psit[1, x, t]]}, {x, -5, 5}, PlotLabel -> Subscript[\[Psi],1]], 
     Plot[Abs[psit[1, x, t]]^2, {x, -5, 5}, PlotStyle -> Directive[Thick, Black],
		PlotLabel -> TraditionalForm[Abs[Subscript[\[Psi],1]]^2]]},
   {Plot[{Re[psinonstationary[x, t]], Im[psinonstationary[x, t]]}, {x, -5, 5}, PlotLabel -> Subscript[\[Psi],N]], 
     Plot[Abs[psinonstationary[x, t]]^2, {x, -5, 5}, PlotStyle -> Directive[Thick, Black],
		PlotLabel -> TraditionalForm[Abs[Subscript[\[Psi],N]]^2]]}
   }, Frame -> All, ImageSize -> 300];
output = Table[MakeFrame[t], {t, 0, 4 Pi*40/41, 4 Pi/41}];
SetDirectory["C:\\Users\\Steve\\Desktop"]
Export["test.gif", output]

لائسنس –

میں، اس کم دے کاپیرائٹ دا مالک، اس کم نوں اس لائسنس دے مطابق چھاپدا واں:
Creative Commons CC-Zero ایس فائل نوں ایہ لسنس کریٹو کامنز CC0 1.0 یونیورسل پبلک ڈومین ڈیڈیکیشن دتا گیا اے۔
اوہ بندا جینے اے کم کیتا اے اونے اے کم public domain دے ناں لایا اے تے سارے حقاں نوں چھڈ دتا اے۔ تسیں اینو کاروبار کم لئی ورت سکدے اے یا بدل سکدے او بنا کسے اجازت دے۔

Captions

Add a one-line explanation of what this file represents

Items portrayed in this file

چترن

۲۰ مارچ 2011

فائل دی تریخ

فائل نو اس ویلے دی حالت وچ ویکھن واسطے تاریخ/ویلے تے کلک کرو۔

تریخ تے ویلہنکی مورتپاسےورتن والاتیپّݨی کرو
موجودہ۲۳:۲۱, ۲۰ مارچ ۲۰۱۱۲۳:۲۱, ۲۰ مارچ ۲۰۱۱ ویلے دے ورژن ساتھ انگوٹھاکار روپ۳۰۰ × ۲۸۰ (۲۲۳ کلوبائٹ)Sbyrnes321{{Information |Description ={{en|1=Three wavefunction solutions to the Time-Dependent Schrödinger equation for a harmonic oscillator. Left: The real part (blue) and imaginary part (red) of the wavefunction. Right: The probability of finding the partic

تھلے دتے گئے 1 صفحے اس فائل نال جُڑدے نیں

فائل ویاپک ورتوں

ایہہ دوجے وکیاں ایس فائل نوں ورتدے نیں –